반응형
comparison criteria or other javascript libraries.
| FusionCharts | amCharts | D3.js | Highcharts | Google Chart Tools | gRaphael | CanvasJS Charts | arcadiaCharts | dhtmlxChart | Dojo (dojox/charting) | Ejschart | Elycharts | Flot | flotr2 | jqChart | jqPlot | JSCharts | JSXGraph | KendoUI DataViz | Morris.js | nvd3 | OLAPCharts | Protovis | Reportivo.com | RGraph | Rickshaw | Sencha Touch Charts | Shield UI Charts | SVGware | TeeChart | zingchart | |
|---|---|---|---|---|---|---|---|---|---|---|---|---|---|---|---|---|---|---|---|---|---|---|---|---|---|---|---|---|---|---|---|
| Website | fusioncharts.com/... | amcharts.com | d3js.org | highcharts.com/... | google.com/... | raphaeljs.com | canvasjs.com | arcadiacharts.com | dhtmlx.com/... | dojotoolkit.org/... | ejschart.com | elycharts.com | flotcharts.org | humblesoftware.com/... | jqchart.com | jqplot.com | jscharts.com | uni-bayreuth.de | kendoui.com/... | oesmith.co.uk/... | nvd3.com | olapcharts.com | stanford.edu/... | reportivo.com | rgraph.net | shutterstock.com/... | sencha.com/... | shieldui.com | svgware.com | steema.com/... | zingchart.com |
| Demo web link | fusioncharts.com/... | amcharts.com/... | github.com/... | highcharts.com/... | google.com/... | raphaeljs.com | canvasjs.com/... | arcadiacharts.com/... | dhtmlx.com/... | dojotoolkit.org/... | ejschart.com/... | elycharts.com/... | flotcharts.org/... | humblesoftware.com/... | jqchart.com/... | jqplot.com/... | jscharts.com/... | uni-bayreuth.de/... | kendoui.com/... | oesmith.co.uk/... | nvd3.com/... | olapcharts.com/... | stanford.edu/... | rgraph.net/... | shutterstock.com/... | sencha.com/... | shieldui.com | svgware.com | steema.com/... | zingchart.com/... | |
| Image |  |  |  |  |  |  |  |  |  |  |  |  |  |  |  |  |  | 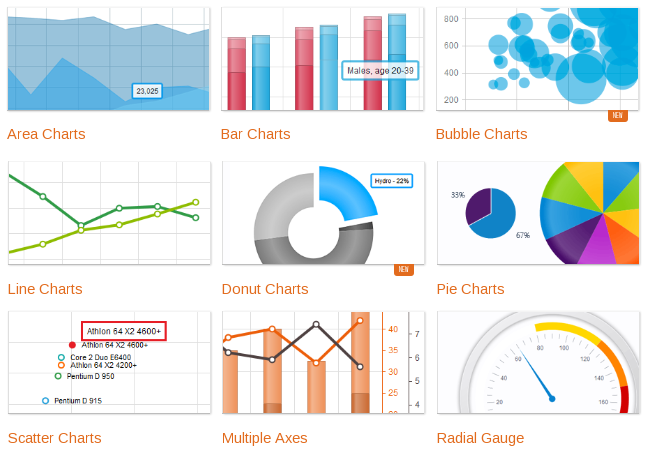 | 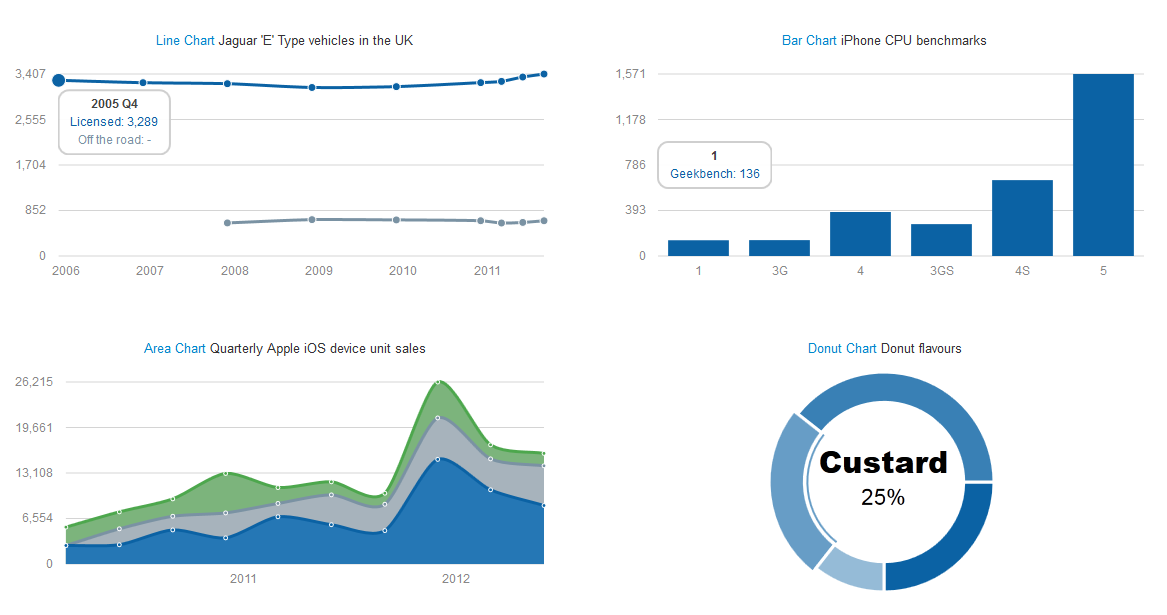 | 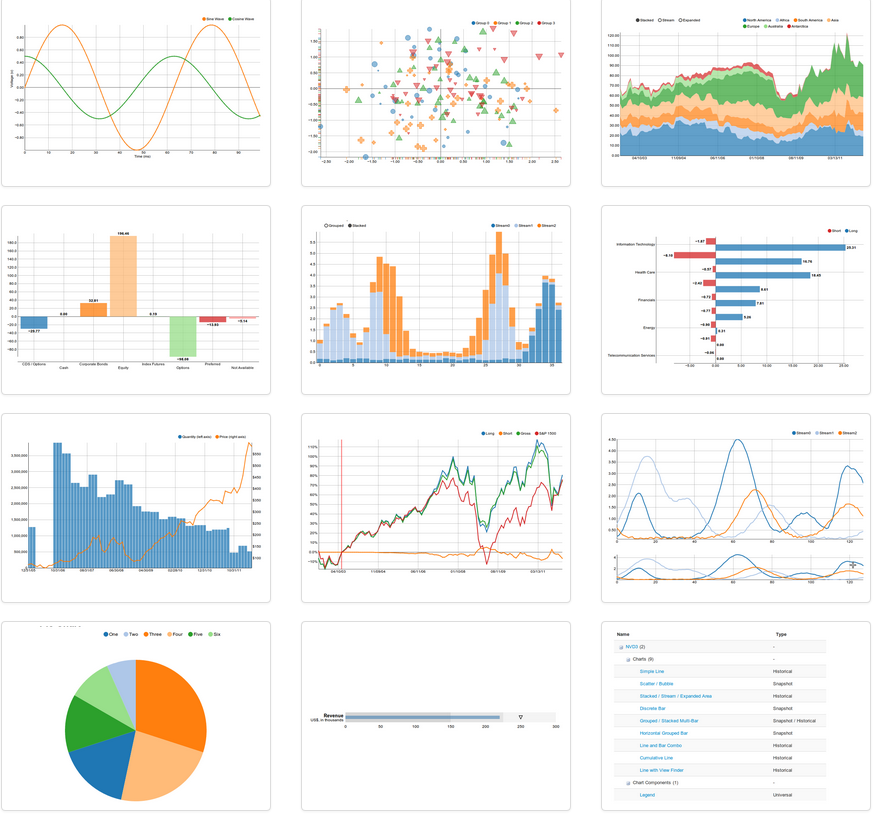 | 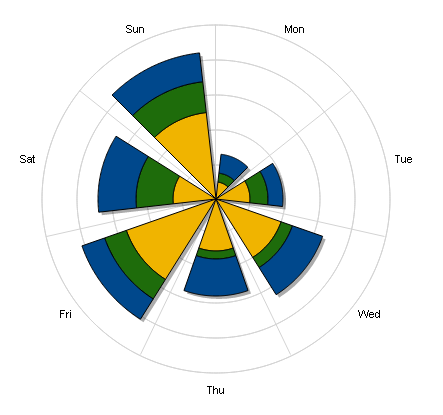 | 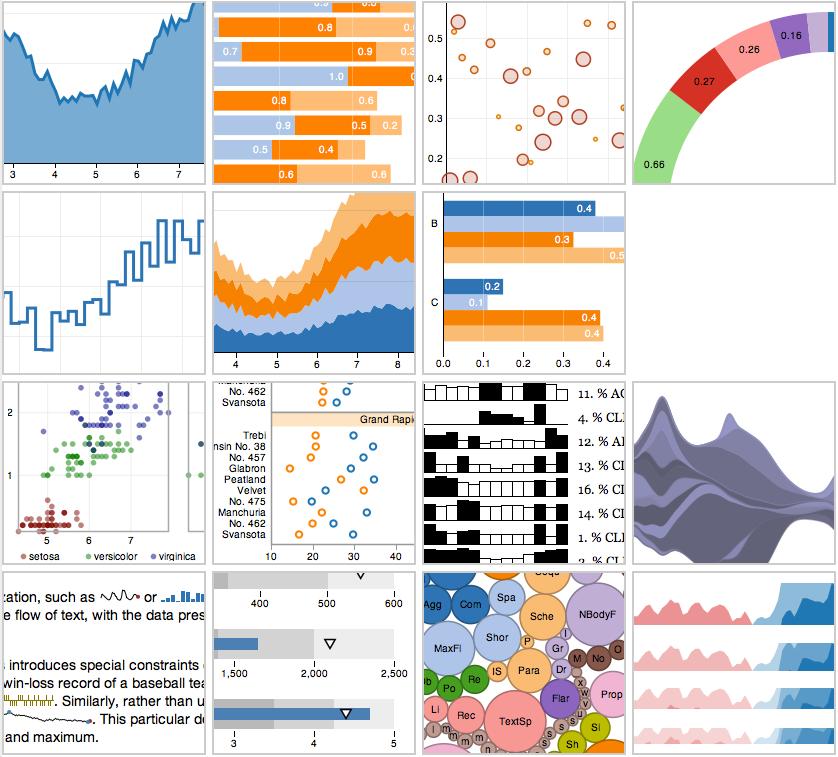 |  | 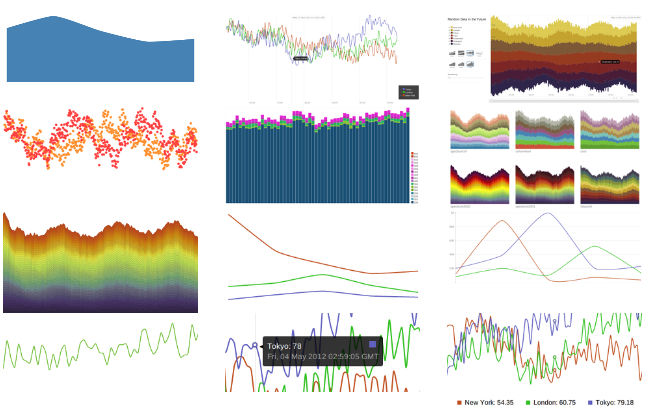 | 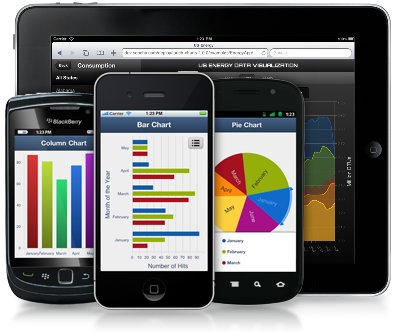 | 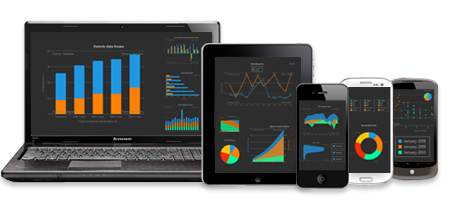 | 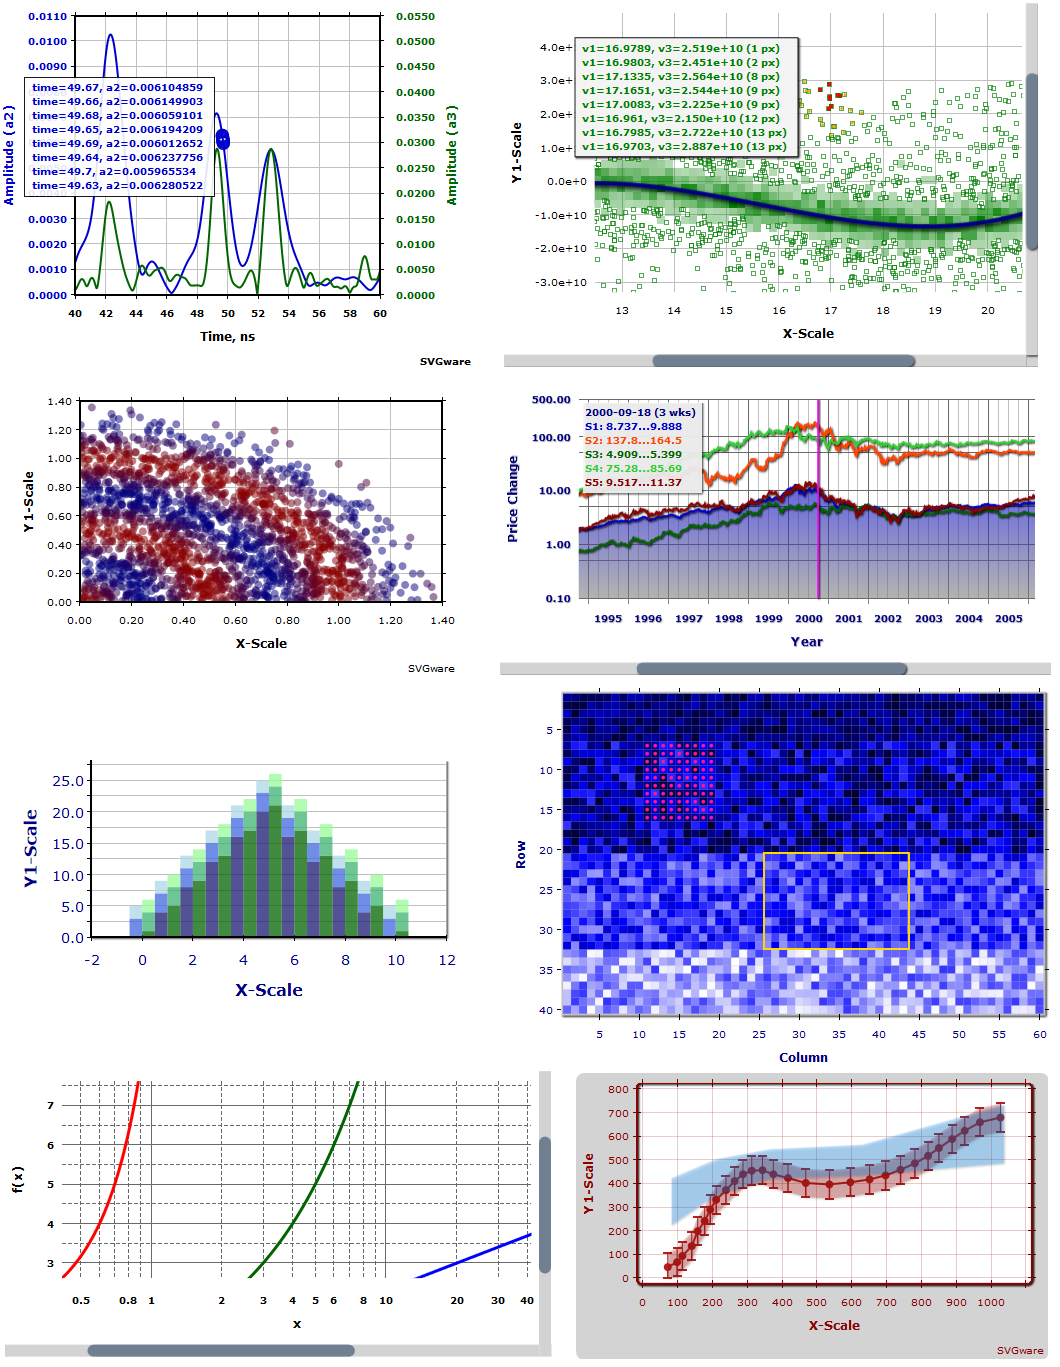 | 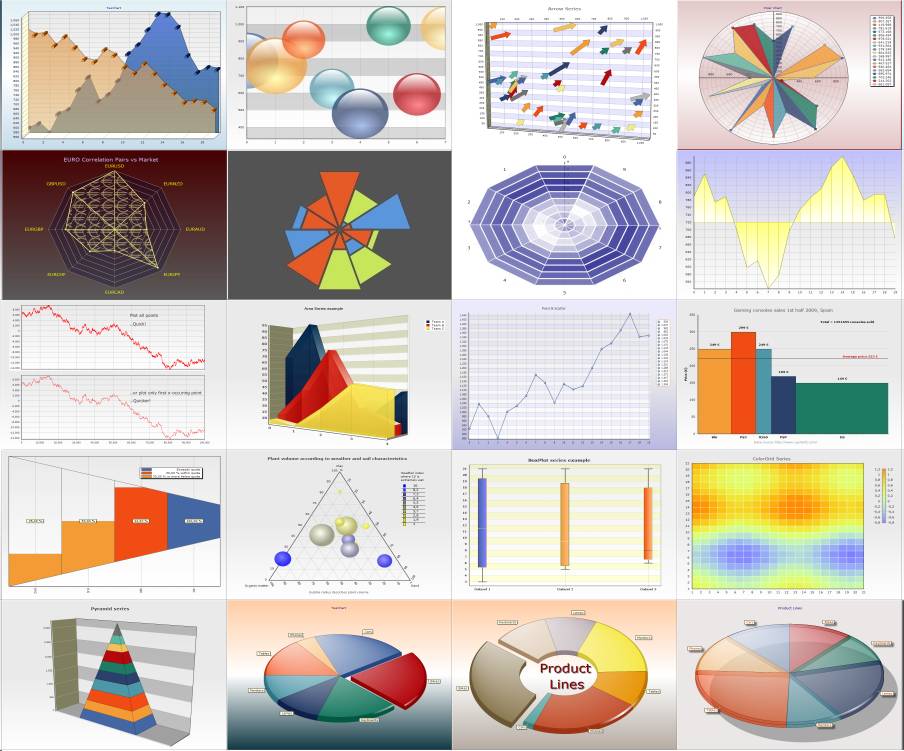 | 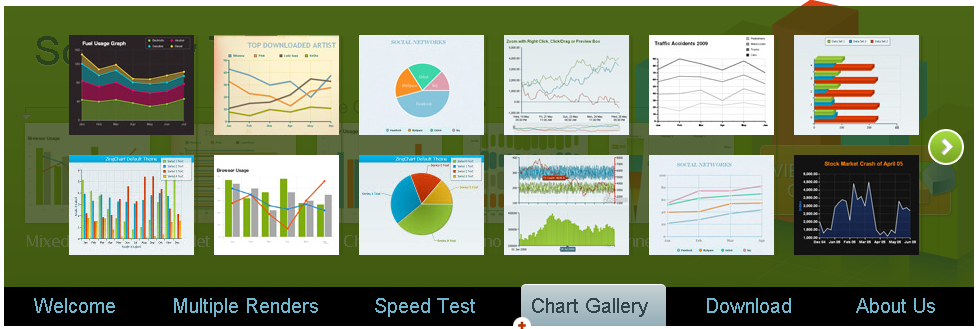 | ||
| Like | |||||||||||||||||||||||||||||||
| Open source | No | No | Yes BSD License | Yes CC by-nc 3.0 | No | Yes MIT License | Yes CC nc 3.0 | No | Yes GNU GPL | Yes BSD, AFLv2 | No | Yes MIT License | Yes MIT License | Yes MIT License | No | Yes MIT, GPL v2 | No | Yes LGPL | No | Yes Simplified BSD | Yes Apache 2.0 | Yes BSD License | No | Yes | No | No | No | No | No | ||
| Latest version | 3.X | 2.10.3 | 1.0 | 0.5.0 | 1.0 | 1.0.2 | 2.6 Build 100928 | 1.8 | 2.3 | 2.1.4-Snapshot (Aug, 2011) | 0.8.1 (may 2013) | 2013 | 3.0 | 0.94 | Q1 2013 | 0.4.1 | 1.0.1 | 3.3.1 | 2012 | 2012 | 1.6.4 | 2.6 (July 2013) | 2012 | 2010 | |||||||
| Trial and Prices | Trial Version Free. | Free with watermark $99 (single website) | Free under BSD | Free for non commercial use $ 80 (single website) - $ 2000 (10 developers license) | Free | Free (you can donate) | Free for non-commercial use $299+ for commercial license | Free for non commercial use $ 89 (single website) - $ 899 (OEM) | Free under GNU GPL, $49 | Free | Free / $100 / $250 / $1000 | Free | Free | Free | $299 | Free | $ 39 - $ 149 Free with watermark | Free | $ 399 | Free | Free depending on Apache 2.0 | Free charts, €99 with additional OLAP features | Free | Free | Free for non-commercial (CreativeCommons) License for commercial use. | Free of charge with copyright attribution | Free under GPLv3 license; $999 commercial license | Free for Non-commercial use. Requires license for commercial | Free | Free for non commercial use. $129 commercial license ( 1developer + 1 server install + 1 year support subscription) | Free with watermark Single Domain Package : $249.00 Discounted Multi-Domain Package : $999.00 SaaS and OEM Pricing Available |
| Library size (compressed+gzip) | 24 KB (only through google link, no offline mode) | 27 KB | 35 KB | 500 KB (can easily be scaled down if you just use a subset of chart types) | 32 kb | 238 KB | 223 KB | 88.5 KB | 52 KB | 50 KB | 60 KB (different files per browser) | 32 KB | 145 kB | 0.7 MB | |||||||||||||||||
| Minified size | 190 KB | 116 kb | 45 kb | 28.5 KB | 54 KB | 170 KB (can easily be scaled down if you just use a subset of chart types) | 65 KB | 95 KB | 96 KB | 439 KB | 29 KB | 153 KB | 4.7 MB | 200 K | 145 kB | ||||||||||||||||
| Dependencies | None | https://github.com/shawnbot/aightfor partial IE8 compatibility. No dependencies needed for other browsers supported | Raphael | None outside of the Dojo Toolkit - VERY nice but heavy for our needs | None | jQuery,Raphael Charts seem kind of dinky. REasonable alternative. | jQuery Comes with unicorn, capable and robust, simple | underscore.js, beam.js No donut chart. Buzzzz. But seems very capable. | jQuery | jQuery 1.9+ | jQuery, Raphael Not exactly sexy. Needs Rapheal and annotations. No data labels, exporting and missing several chart types | d3.js and Aight for IE8 support - VERY cool but based on D3, no IE8 and prior. | None | none | d3.js | jQuery | None | ||||||||||||||
| Graphic technology | SVG / VML | SVG or VML for old IE | SVG | SVG | SVG | SVG | CanvasJS | Canvas | Canvas | SVG, Canvas if not available VML or Silverlight | Canvas / SVG / VML | SVG | Canvas | Canvas | Canvas | Canvas | Canvas | SVG | SVG | SVG | SVG | HTML5 Canvas, Flash | SVG | Canvas | SVG | Canvas | SVG, VML | SVG | Canvas | HTML5 / Canvas / SVG / VML / Flash | |
| Charts types | |||||||||||||||||||||||||||||||
| Area | Yes | Yes | Yes | Yes | Yes | Yes Line charts can also have fills | Yes | No | Yes | Yes | Yes | Yes | Yes | Yes Line charts can also have fills | Yes | Yes | No | No | Yes | Yes | Yes | Yes | Yes | Yes | Yes | Yes | Yes | Yes | Yes | Yes | Yes |
| Bar | Yes | Yes | Yes | Yes horizontal, vertical | Yes | Yes (8 Kb) vertical only | Yes | Yes | Yes | Yes | Yes | Yes vertical only | Yes | Yes | Yes | Yes | Yes vertical only | Yes | Yes | Yes vertical only | Yes | Yes | Yes | Yes | Yes | Yes vertical only | Yes | Yes | Yes | Yes | Yes |
| Bubble | Yes | Yes | Yes | No | No | Yes | No | No | Yes | No | No | Yes plugin | Yes | Yes | Yes | No | No | Yes | No | Yes | Yes | Yes | Yes | No | No | Yes | Yes | Yes | Yes | ||
| Line | Yes | Yes | Yes | Yes | Yes | Yes (4 Kb) | Yes | Yes | Yes | Yes | Yes | Yes | Yes | Yes | Yes | Yes | Yes | Yes | Yes | Yes | Yes | Yes | Yes | Yes | Yes | Yes | Yes | Yes | Yes | Yes | Yes |
| Pie | Yes | Yes | Yes | Yes | Yes | Yes (4 Kb) | Yes | Yes | Yes | Yes | Yes | Yes | Yes | Yes | Yes | Yes | Yes | Yes | Yes | No | Yes | Yes | Yes | Yes | Yes | No | Yes | Yes | No | Yes | Yes |
| Scatter | Yes | Yes | Yes | Yes | Yes | No | Yes | No | Yes | Yes | No | Yes | Yes | Yes | Yes | No | No | Yes | No | Yes | Yes | Yes | Yes | Yes | Yes | Yes | Yes | Yes | Yes | Yes | |
| Spline | Yes | Yes | Yes | Yes | No | No | Yes | No | Yes only line, not area | Yes | - In progress for next revision | Yes | Yes | No | Yes | Yes | No | Yes only line, not area | No | Yes | Yes | Yes | Yes | Yes | No | Yes by default | Yes | Yes | No | Yes | Yes |
| Sparklines | Yes | Yes | Yes | No | No | Yes | Yes | - In progress for next revision | Yes | Yes | Yes | No | Yes | No | No | Yes | No | Yes | |||||||||||||
| Candlestick | Yes | Yes | - Unofficial example: https://gist.github.com/1074045 | Yes Highstock, separate product | Yes | No | No | No | No | Yes | Yes | No | Yes plugin: http://jumflot.jumware.com/candlestick.html | Yes | Yes | Yes | No | No | Yes | No | No | Yes | No | No | No | No | Yes | Yes | |||
| Donut | Yes | Yes | Yes | Yes | No | No | Yes | Yes | Yes | No | Yes | Yes | Yes | No | No | Yes | No | No | Yes | Yes | Yes | Yes | Yes | Yes | Yes | No | No | Yes | No | Yes | Yes |
| Node / Edge graph | Yes | Yes | |||||||||||||||||||||||||||||
| Other charts | Column, Funnel, Pyramid, Waterfall, Marimekko, Gauges, Gantt Charts, Heat Map, Radar, Box and Whisker, Kagi, Step Line | Gauges, Radar, Polar, Step line, Step without Risers, OHLC, area range, Donut, Funnel, Waterfall, Bullet, XY, Maps are available as additional package | D3.js is a drawing library, and not just a chart library. You can make virtually any visualization or graph given time. | Geo chart, table, gauge, tree map | Bubble Chart | Bubble, Candlestick (OHLC), Spider. Other Dojo modules provide as well TreeMap, Gauges etc... | f(x), Gauge, Donut, alarm, candle stick, step series, over under, open high low, error series, stacked bar, trend, and floating bar | Funnel | Bubbles, Gantt, Pyramid, Spider | Bubble, radar | Bubble, radar, polar | Math... | Linear Gauge, Radial Gauge, Bubble, Bullet, Donut, Scatter, Stock | Bullet chart | Spline, Donut, Rose, Radar, HeatMap, Combined | TreeMap, Node links | Range Bar/Area/Spline Area, Polar Bar/Area/Spline/Scatter/Stepline/Steparea | Gauge, Funnel, Waterfall | Range Bar/Area/SplineArea, Polar Bar/Area/Spline/Scatter, Stepline, Steparea | heat map; error bars; linear and logarithmic scales; | Horizbar, SmoothLine, Donut, HorizArea, Bubble, Candle (OHLC) | Bullet, Chord, Funnel, Gauge, Grid, Maps, Pareto, Piano, Radar, Rankflow, Stock, Treemap, Venn, WordCloud | |||||||||
| Features | |||||||||||||||||||||||||||||||
| Multitouch | |||||||||||||||||||||||||||||||
| Ability to zoom in and out of charts | Yes | Yes | Yes | Yes | No | No | Yes | No | Yes | Yes | No | Yes | Yes | Yes | Yes | No | No | Yes | No | Yes | Yes | Yes | No | Yes | Yes | Yes | Yes | Yes | |||
| Annotations on the chart | Yes | Yes | No | No | No | Yes | No | Yes | No | Yes | Yes | Yes | Yes | No | Yes | No | Yes | Yes | Yes | Yes | No | Yes | Yes | Yes | Yes | ||||||
| Combination of charts | Yes | Yes | Yes | Yes | Yes | No | Yes | Yes | No | Yes | Yes | No | Yes | Yes | Yes | Yes | Yes | Yes | Yes | No | Yes | Yes | Yes | No | Yes | Yes | Yes | Yes | |||
| Data labels | Yes | Yes | Yes | Yes | No | Yes | Yes | Yes | - Only on a subet of charts, improvement planned for future versions | Yes | Yes | Yes | Yes | Yes | Yes | Yes | Yes | No | Yes | Yes | Yes | Yes | No | Yes | Yes | Yes | Yes | Yes | |||
| Date-time axis | Yes | Yes | Yes | Yes | Yes | No | Yes | No | - Feasible with custom code | Yes | No | Yes | Yes | Yes | No | Yes | Yes | Yes | Yes | Yes | No | Yes | Yes | Yes | Yes | ||||||
| Dynamic charts | Yes | Yes | Yes | Yes | No | No | Yes | Yes | Yes | Yes | Yes | Yes | Yes | Yes | Yes | Yes | No | Yes | Yes | Yes | Yes | Yes | No | Yes | Yes | Yes | Yes | ||||
| Export files | Yes | Yes PNG, JPG, SVG, PDF | Yes | No | No | No | Yes SVG | - | No | No | Yes PNG, JPG | Yes | Yes | No | Yes | No | Yes | No Workaround available | Yes | - | Yes | Yes | Yes | Yes | |||||||
| External Data Loading | Yes | No | No | Yes | Yes Using dojo/store | Yes | No | Yes | No | Yes | Yes | No | Yes | Yes | No | Yes | Yes | Yes | Yes | Yes | - | Yes | Yes | ||||||||
| Interactive (responds to mouse hover/click) | Yes | No | Yes | Yes | Yes | Yes | Yes | No | No | Yes | Yes | Yes turned off by default | Yes | Yes | Yes turned off by default | No | Yes no tooltips | Yes | Yes | Yes | Yes | No | Yes | Yes | Yes turned off by default | Yes tooltips on touch | Yes | Yes | Yes | Yes | |
| Yes | Yes | No | No | No | Yes | Yes | Yes | No | No | - only by using browser | No | Yes | No | Yes | Yes | Yes | Yes | ||||||||||||||
| Text Rotation for Labels | Yes | Yes | Yes x-y coordinates(of text) needs to be changed after rotation of text | Yes | No | No | Yes | Yes With CSS | Yes | Yes | Yes | Yes | Yes | Yes | No | No | Yes | No | Yes | Yes | Yes | Yes | Yes | Yes | |||||||
| Platforms | |||||||||||||||||||||||||||||||
| Firefox | Yes | Yes | Yes | Yes | Yes | Yes 3.0+ | Yes | Yes | Yes 1.0+ | Yes 3.6+ | Yes 1.5+ | Yes 3.0+ | Yes | Yes | Yes | Yes | Yes 1.5+ | Yes 2.0+ | Yes | Yes | Yes | Yes | Yes | Yes | Yes | Yes | Yes | Yes | Yes | Yes | |
| Internet Explorer | Yes | Yes 6.0+ | - IE 9 is supported, IE 8 is supported with Aight | Yes 6.0+ | Yes | Yes 6.0+ | Yes 9+ | Yes | Yes 6.0+ | Yes 6+ | Yes 6.0+ | Yes 6.0+ | Yes 6.0+ | Yes 6.0+ | Yes 6.0+ | Yes 7.0+ | Yes 8.0+ | Yes 6.0+ | Yes 7+ | Yes 6.0+ | - IE 9, IE8 requires Aight | Yes Uses Flash for < IE9 | No Partial | Yes | - IE 9, IE8 requires Aight or Google Chrome Frame or Google ExCanvas | - IE 9, IE8 requires Aight | Yes 5.0+ | Yes | Yes 9.0+ | Yes 6.0+ | |
| Google Chrome | Yes 5.0+ | Yes | Yes | Yes | Yes | Yes 5.0+ | Yes | Yes | Yes | Yes | Yes | Yes 5.0+ | Yes | Yes | Yes | Yes | Yes 10+ | Yes | Yes | Yes | Yes | Yes | Yes | Yes | Yes | Yes | Yes | Yes | Yes | Yes | |
| Safari | Yes | Yes | Yes | Yes | Yes | Yes 3.0+ | Yes | Yes | Yes 3.0+ | Yes | Yes 3.1 (2.0 on MAC) | Yes 3.0+ | Yes | Yes | Yes | Yes | Yes 3.1+ | Yes 3.0+ | Yes | Yes | Yes | Yes | Yes | Yes | Yes | Yes | Yes | Yes | Yes | ||
| Opera | Yes | Yes | Yes | Yes | Yes | Yes 9.5+ | Yes | Yes | Yes 9.0+ | - Might work but not officially supported | Yes 9+ | Yes 9.5+ | Yes | Yes | Yes | Yes 9+ | Yes | Yes | Yes | Yes | Yes | Yes | Yes | Yes | Yes | Yes | Yes | Yes | |||
| iPhone | Yes | Yes | Yes | Yes | Yes | Yes | Yes | Yes | Yes | Yes 1+ | Yes | Yes | Yes | Yes | Yes 1.0+ | Yes | Yes | Yes | Yes | Yes | Yes | Yes | Yes | Yes | Yes | Yes | Yes | Yes | Yes | ||
| iPad | Yes | Yes | Yes | Yes | Yes | Yes | Yes | Yes | Yes | Yes | Yes | Yes | Yes | Yes | Yes | Yes | Yes | Yes | Yes | Yes | Yes | Yes | Yes | Yes | Yes | Yes | Yes | Yes | Yes | ||
| Social Networks | |||||||||||||||||||||||||||||||
| Source code repository | github.com/... | github.com/... | github.com/... | bitbucket.org/... | github.com/... | github.com/... | github.com/... | ||||||||||||||||||||||||
| @FusionCharts | @amcharts | @Highcharts | @RaphaelJS | @dhtmlx | @dojo | @ejscharts | @Elycharts | @jqChart | @jecomponents | @KendoUI | @olly_smith | @instantOLAP | @ReportivoOnline | @sencha | @shieldui | @SteemaSoftware | @zingchart | ||||||||||||||
| Website | fusioncharts.com/... | amcharts.com | d3js.org | highcharts.com/... | google.com/... | raphaeljs.com | canvasjs.com | arcadiacharts.com | dhtmlx.com/... | dojotoolkit.org/... | ejschart.com | elycharts.com | flotcharts.org | humblesoftware.com/... | jqchart.com | jqplot.com | jscharts.com | uni-bayreuth.de | kendoui.com/... | oesmith.co.uk/... | nvd3.com | olapcharts.com | stanford.edu/... | reportivo.com | rgraph.net | shutterstock.com/... | sencha.com/... | shieldui.com | svgware.com | steema.com/... | zingchart.com |
| Website |
|---|
| Demo web link |
| Image |
| Like |
| Open source |
| Latest version |
| Trial and Prices |
| Library size (compressed+gzip) |
| Minified size |
| Dependencies |
| Graphic technology |
| Charts types |
| Area |
| Bar |
| Bubble |
| Line |
| Pie |
| Scatter |
| Spline |
| Sparklines |
| Candlestick |
| Donut |
| Node / Edge graph |
| Other charts |
| Features |
| Multitouch |
| Ability to zoom in and out of charts |
| Annotations on the chart |
| Combination of charts |
| Data labels |
| Date-time axis |
| Dynamic charts |
| Export files |
| External Data Loading |
| Interactive (responds to mouse hover/click) |
| Text Rotation for Labels |
| Platforms |
| Firefox |
| Internet Explorer |
| Google Chrome |
| Safari |
| Opera |
| iPhone |
| iPad |
| Social Networks |
| Source code repository |
| Website |
반응형
'Cloud 개발' 카테고리의 다른 글
| DES 알고리즘 C (0) | 2018.12.26 |
|---|---|
| SHA1withRSA, SHA1withDSA 완성 (0) | 2018.12.26 |
| DB암호화 방식 비교 (0) | 2018.12.26 |
| open source로 sso 서비스 구현하기 (0) | 2016.11.17 |
| 국산 블럭암호 ARIA 기술 (2) | 2016.11.17 |